Communities Unlimited staff began an EPA National Priority 1 Drinking Water Technical Assistance grant-funded mapping project with the East Columbia Water District (ECWD) on Feb. 20, 2024. The objective was to construct a comprehensive Geographic Information System (GIS) poised to revolutionize the management of the district’s water system.
Founded in September 1949, the ECWD provides water services for Caldwell, Catahoula, and Ouachita Parishes in the central part of Louisiana. It covers a large geographical area, extending 46 miles from its northernmost to southernmost points. The distribution network serves 976 customers, encompassing approximately 165 miles of pipe.
The water system has progressively expanded over the years. This expansion was evident when the district assumed management of Big Ridge Water System in 1981 and added the Ouachita Parish in 1996.
With such an extensive service area, it presented a significant management hurdle for the current operator, Hunter Fulton, and manager, Hope Lueck, to maintain documentation of the overall water district.
“Before when we hired a new operator, we spent tremendous time training them about where things are located,” Lueck said. “I couldn’t get them to document it. If you are not documenting and keeping records in-house when that person leaves, all that information leaves with them.”
ECWD recognized a need to improve documentation within its district. That’s when CU stepped in to assist. Don Becker, GIS Coordinator at CU, along with Richard King and Chris Brunson, from CU’s Louisiana Community Infrastructure devised a plan for ECWD to develop a fully functional GIS application, which is a computer system software for capturing, storing, checking, and displaying data related to positions on Earth’s surface.
CU set up ECWD with the GIS product using ArcGIS Online, the world’s leading mapping software. The process of assembling, configuring, and updating a GIS map and database demands significant labor and attention. But once accomplished, the advantages are immense.
To put it into perspective, the water district is now capable of seeing different kinds of data on one map. From where water lines are located, to hydrants, and meters, all the information is now readily available, making the process for documentation significantly smoother.
“That’s the greatest benefit of having this GIS program,” Lueck said. “Now we can open up the software and look at it to find where things are located.
"The recordkeeping element has been huge. It saves us money. Our operators don’t spend as much time out there doing locates and making repairs. It’s a huge cost-savings benefit.”
— Hope Lueck, Manager, East Columbia Water District
Not only does GIS enable both field staff and office staff to access the same dataset, but it also enhances communication and streamlines everyday tasks. The GIS product also offers specialized functionalities that can be tailored to enhance asset management, work coordination, and the Lead Service Line Inventory process.
Mr. Fulton’s background qualifies him as a GIS professional. He earned his bachelor’s degree in GIS from Louisiana Tech in 2016. Previously, he served as a GIS Technician for a water infrastructure and management company called Inframark from 2017-2022, overseeing the GIS Department for greater Ouachita Water Company in Louisiana’s Ouachita Parish.
In addition, Fulton has earned all five Class 4 certifications, including three in water and two in wastewater. That’s the highest level one can achieve in the state of Louisiana. His experience allows him to configure and customize his GIS products to better achieve the objectives of the system, but the maps, applications, and dashboards are user-friendly and easy to use for those with no prior GIS experience.
As the lead operator in ECWD, Fulton said CU integrating this technology in the water district has already been beneficial in his day-to-day role. He’s certainly excited to utilize this product.
“It was big for CU to come in and get this knocked out for us,” Fulton said. “To have something like this in my pocket on this system, I can quickly and easily look at it. I can determine the lines on that side of the road. The valves should be over here. That helps a lot because we have a lot of ground to cover. To keep all that information stored in your head, that’s difficult.
“To have the GIS system in place that shows all my lines, all my valves, it makes things so much easier. I’m excited to have this tool in my back pocket.”
— Hunter Fulton, Operator, East Columbia Water District
Once CU completed the initial field data collection process, attention shifted to designing a Lead Service Line Inventory (LSLI) map. This map uses the Water Meter layer but displays different attributes from the original system map, aimed at illustrating inventory progress and outcomes.
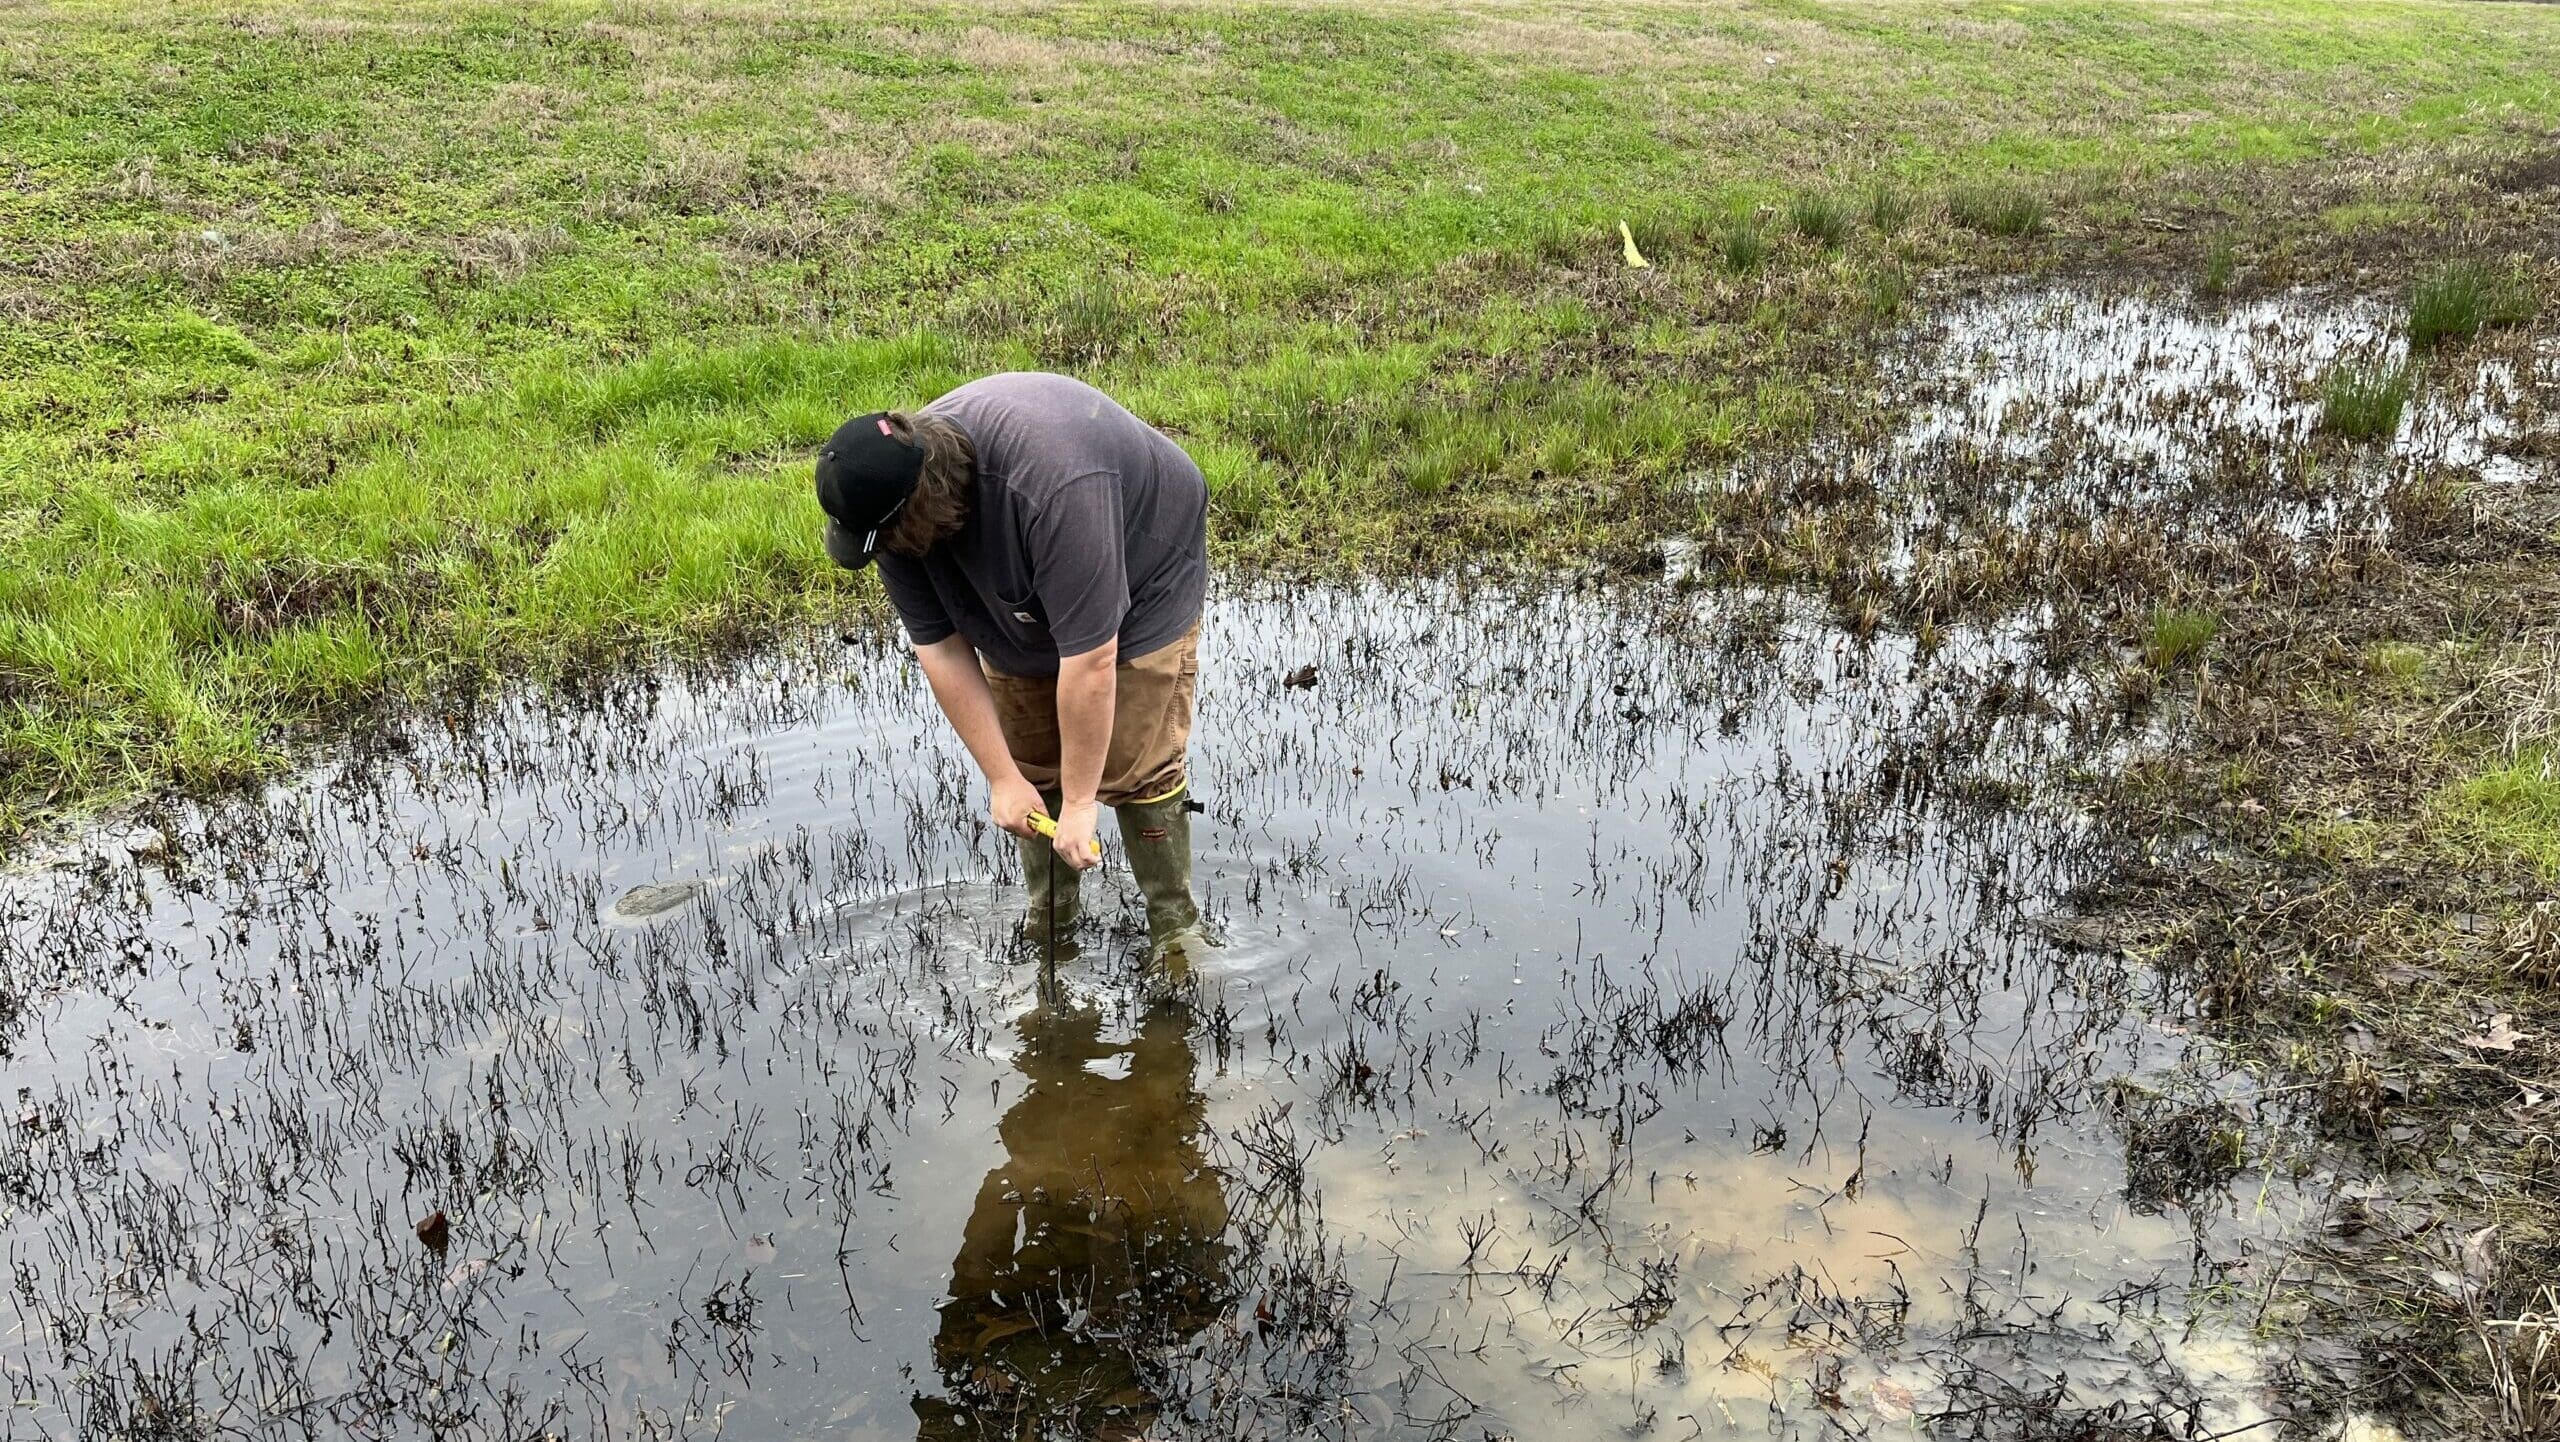
CU GIS Specialist Alex Webb built a dashboard specifically designed to monitor the LSLI process. The workflow for the Lead Service Line Inventory involves ECWD staff visiting each meter box, uncovering the pipes on both the service and customer sides of the meter, identifying materials present, and updating material types in the database.
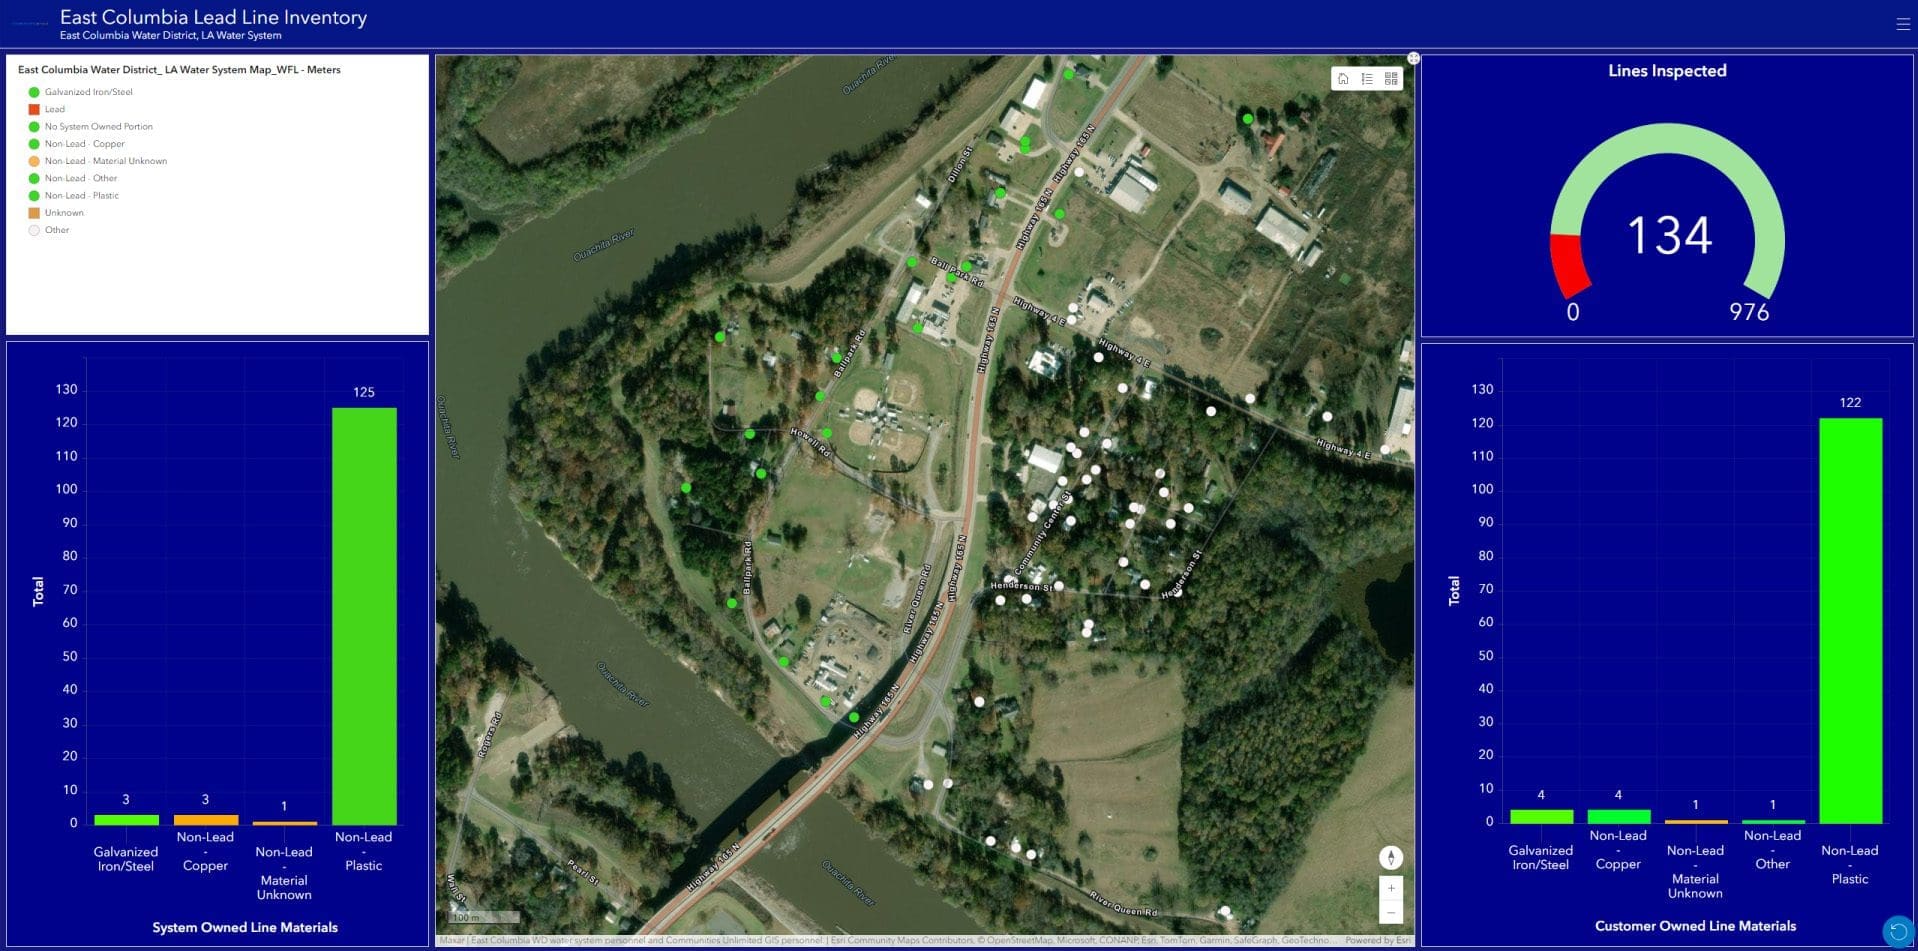
As data values are populated, the color of the point on the map transitions from the white (no value) to a color representing the identified material. Currently, 134 out of 976 customer connections have been evaluated, with inventory progress remaining on schedule for completion.
Once finalized, the results will be integrated into an Excel workbook provided by the Louisiana Department of Health for reporting LSLI findings to the state.
Learn more about how CU’s GIS program assists rural communities